Some simple ways to make histogram or line plots using matplotlib.
import pandas as pdimport matplotlib.pyplot as pltimport numpy as np
The Air Passengers Dataset This dataset shows the number of passengers flying United States airlines by month from 1949-1960.
from pydataset import datapassengers = data('AirPassengers' )
time
AirPassengers
1
1949.000000
112
2
1949.083333
118
3
1949.166667
132
4
1949.250000
129
5
1949.333333
121
6
1949.416667
135
7
1949.500000
148
8
1949.583333
148
9
1949.666667
136
10
1949.750000
119
11
1949.833333
104
12
1949.916667
118
#1 Add a ‘year’ column to passengers that reflects the current year import numpy as nppassengers['Year' ] = passengers['time' ].apply(lambda x: int (x)) passengers
time
AirPassengers
year
month
Year
1
1949.000000
112
1949
1.0
1949
2
1949.083333
118
1949
2.0
1949
3
1949.166667
132
1949
3.0
1949
4
1949.250000
129
1949
4.0
1949
5
1949.333333
121
1949
5.0
1949
6
1949.416667
135
1949
6.0
1949
7
1949.500000
148
1949
7.0
1949
8
1949.583333
148
1949
8.0
1949
9
1949.666667
136
1949
9.0
1949
10
1949.750000
119
1949
10.0
1949
11
1949.833333
104
1949
11.0
1949
12
1949.916667
118
1949
12.0
1949
13
1950.000000
115
1950
1.0
1950
14
1950.083333
126
1950
2.0
1950
15
1950.166667
141
1950
3.0
1950
16
1950.250000
135
1950
4.0
1950
17
1950.333333
125
1950
5.0
1950
18
1950.416667
149
1950
6.0
1950
19
1950.500000
170
1950
7.0
1950
20
1950.583333
170
1950
8.0
1950
21
1950.666667
158
1950
9.0
1950
22
1950.750000
133
1950
10.0
1950
23
1950.833333
114
1950
11.0
1950
24
1950.916667
140
1950
12.0
1950
25
1951.000000
145
1951
1.0
1951
26
1951.083333
150
1951
2.0
1951
27
1951.166667
178
1951
3.0
1951
28
1951.250000
163
1951
4.0
1951
29
1951.333333
172
1951
5.0
1951
30
1951.416667
178
1951
6.0
1951
31
1951.500000
199
1951
7.0
1951
32
1951.583333
199
1951
8.0
1951
33
1951.666667
184
1951
9.0
1951
34
1951.750000
162
1951
10.0
1951
35
1951.833333
146
1951
11.0
1951
36
1951.916667
166
1951
12.0
1951
37
1952.000000
171
1952
1.0
1952
38
1952.083333
180
1952
2.0
1952
39
1952.166667
193
1952
3.0
1952
40
1952.250000
181
1952
4.0
1952
41
1952.333333
183
1952
5.0
1952
42
1952.416667
218
1952
6.0
1952
43
1952.500000
230
1952
7.0
1952
44
1952.583333
242
1952
8.0
1952
45
1952.666667
209
1952
9.0
1952
46
1952.750000
191
1952
10.0
1952
47
1952.833333
172
1952
11.0
1952
48
1952.916667
194
1952
12.0
1952
49
1953.000000
196
1953
1.0
1953
50
1953.083333
196
1953
2.0
1953
51
1953.166667
236
1953
3.0
1953
52
1953.250000
235
1953
4.0
1953
53
1953.333333
229
1953
5.0
1953
54
1953.416667
243
1953
6.0
1953
55
1953.500000
264
1953
7.0
1953
56
1953.583333
272
1953
8.0
1953
57
1953.666667
237
1953
9.0
1953
58
1953.750000
211
1953
10.0
1953
59
1953.833333
180
1953
11.0
1953
60
1953.916667
201
1953
12.0
1953
61
1954.000000
204
1954
1.0
1954
62
1954.083333
188
1954
2.0
1954
63
1954.166667
235
1954
3.0
1954
64
1954.250000
227
1954
4.0
1954
65
1954.333333
234
1954
5.0
1954
66
1954.416667
264
1954
6.0
1954
67
1954.500000
302
1954
7.0
1954
68
1954.583333
293
1954
8.0
1954
69
1954.666667
259
1954
9.0
1954
70
1954.750000
229
1954
10.0
1954
71
1954.833333
203
1954
11.0
1954
72
1954.916667
229
1954
12.0
1954
73
1955.000000
242
1955
1.0
1955
74
1955.083333
233
1955
2.0
1955
75
1955.166667
267
1955
3.0
1955
76
1955.250000
269
1955
4.0
1955
77
1955.333333
270
1955
5.0
1955
78
1955.416667
315
1955
6.0
1955
79
1955.500000
364
1955
7.0
1955
80
1955.583333
347
1955
8.0
1955
81
1955.666667
312
1955
9.0
1955
82
1955.750000
274
1955
10.0
1955
83
1955.833333
237
1955
11.0
1955
84
1955.916667
278
1955
12.0
1955
85
1956.000000
284
1956
1.0
1956
86
1956.083333
277
1956
2.0
1956
87
1956.166667
317
1956
3.0
1956
88
1956.250000
313
1956
4.0
1956
89
1956.333333
318
1956
5.0
1956
90
1956.416667
374
1956
6.0
1956
91
1956.500000
413
1956
7.0
1956
92
1956.583333
405
1956
8.0
1956
93
1956.666667
355
1956
9.0
1956
94
1956.750000
306
1956
10.0
1956
95
1956.833333
271
1956
11.0
1956
96
1956.916667
306
1956
12.0
1956
97
1957.000000
315
1957
1.0
1957
98
1957.083333
301
1957
2.0
1957
99
1957.166667
356
1957
3.0
1957
100
1957.250000
348
1957
4.0
1957
101
1957.333333
355
1957
5.0
1957
102
1957.416667
422
1957
6.0
1957
103
1957.500000
465
1957
7.0
1957
104
1957.583333
467
1957
8.0
1957
105
1957.666667
404
1957
9.0
1957
106
1957.750000
347
1957
10.0
1957
107
1957.833333
305
1957
11.0
1957
108
1957.916667
336
1957
12.0
1957
109
1958.000000
340
1958
1.0
1958
110
1958.083333
318
1958
2.0
1958
111
1958.166667
362
1958
3.0
1958
112
1958.250000
348
1958
4.0
1958
113
1958.333333
363
1958
5.0
1958
114
1958.416667
435
1958
6.0
1958
115
1958.500000
491
1958
7.0
1958
116
1958.583333
505
1958
8.0
1958
117
1958.666667
404
1958
9.0
1958
118
1958.750000
359
1958
10.0
1958
119
1958.833333
310
1958
11.0
1958
120
1958.916667
337
1958
12.0
1958
121
1959.000000
360
1959
1.0
1959
122
1959.083333
342
1959
2.0
1959
123
1959.166667
406
1959
3.0
1959
124
1959.250000
396
1959
4.0
1959
125
1959.333333
420
1959
5.0
1959
126
1959.416667
472
1959
6.0
1959
127
1959.500000
548
1959
7.0
1959
128
1959.583333
559
1959
8.0
1959
129
1959.666667
463
1959
9.0
1959
130
1959.750000
407
1959
10.0
1959
131
1959.833333
362
1959
11.0
1959
132
1959.916667
405
1959
12.0
1959
133
1960.000000
417
1960
1.0
1960
134
1960.083333
391
1960
2.0
1960
135
1960.166667
419
1960
3.0
1960
136
1960.250000
461
1960
4.0
1960
137
1960.333333
472
1960
5.0
1960
138
1960.416667
535
1960
6.0
1960
139
1960.500000
622
1960
7.0
1960
140
1960.583333
606
1960
8.0
1960
141
1960.666667
508
1960
9.0
1960
142
1960.750000
461
1960
10.0
1960
143
1960.833333
390
1960
11.0
1960
144
1960.916667
432
1960
12.0
1960
#2 Add a “month” column passengers['month' ] = (passengers['time' ] -passengers['year' ])*12 +1 passengers['Month' ]= (passengers['Year' ]-min (passengers['Year' ]))*12 +passengers['month' ]
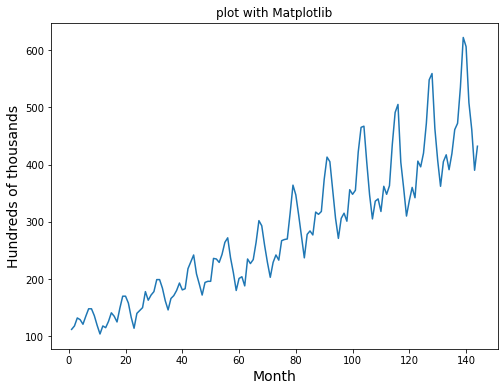
#3 Generate the plot below of passengers vs. time using each monthly count temp=passengers.groupby(['Month' ])['AirPassengers' ].sum ().reset_index() plt.figure(figsize=(8 ,6 )) plt.plot(temp['Month' ],temp['AirPassengers' ]) plt.xlabel("Month" , size=14 ) plt.ylabel("Hundreds of thousands" , size=14 ) plt.title("plot with Matplotlib" )
Text(0.5, 1.0, 'plot with Matplotlib')
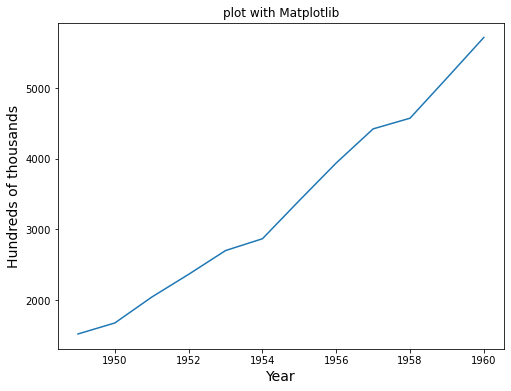
#4 Generate the plot below of passengers vs. time using an annual count temp=passengers.groupby(['Year' ])['AirPassengers' ].sum ().reset_index() plt.figure(figsize=(8 ,6 )) plt.plot(temp['Year' ],temp['AirPassengers' ]) plt.xlabel("Year" , size=14 ) plt.ylabel("Hundreds of thousands" , size=14 ) plt.title("plot with Matplotlib" )
Text(0.5, 1.0, 'plot with Matplotlib')
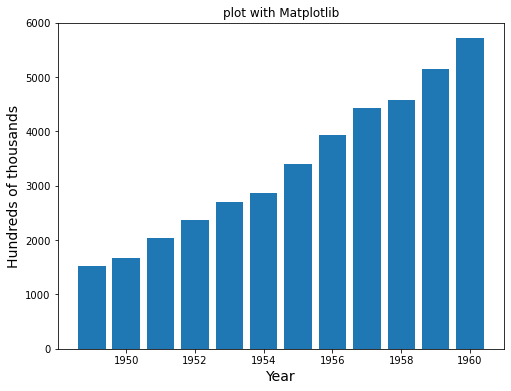
#5 Generate the barplot below of passengers by year temp=passengers.groupby(['Year' ])['AirPassengers' ].sum ().reset_index() plt.figure(figsize=(8 ,6 )) plt.bar(temp['Year' ],temp['AirPassengers' ]) plt.xlabel("Year" , size=14 ) plt.ylabel("Hundreds of thousands" , size=14 ) plt.ylim([0 , 6000 ]) plt.title("plot with Matplotlib" )
Text(0.5, 1.0, 'plot with Matplotlib')
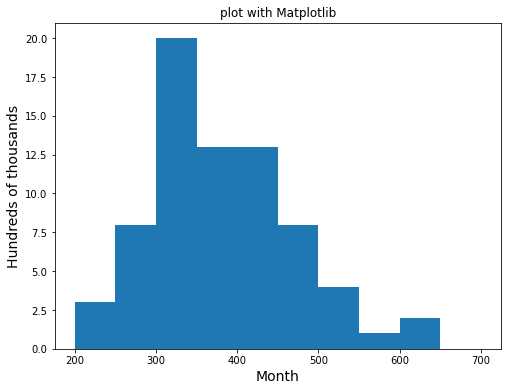
#6 Generate the histogram below of monthly passengers Additional requirements:
Only include 1955 and beyond
Use a binwidth of 50, a min of 200, and a max of 700
Set the yticks to start at 0, end at 25 by interval of 5
temp=passengers[passengers['Year' ]>=1955 ].groupby(['Month' ])['AirPassengers' ].sum ().reset_index() plt.figure(figsize=(8 ,6 )) plt.hist(temp['AirPassengers' ],bins=10 ,range =(200 ,700 )) plt.xlabel("Month" , size=14 ) plt.ylabel("Hundreds of thousands" , size=14 ) plt.title("plot with Matplotlib" )
Text(0.5, 1.0, 'plot with Matplotlib')
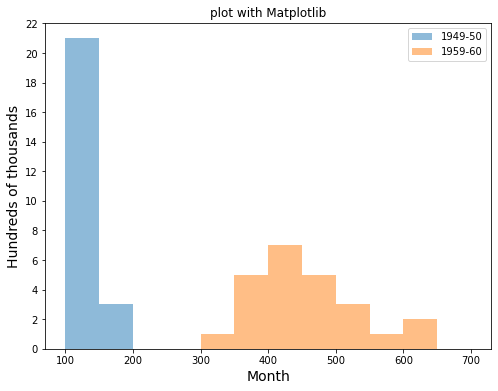
#7 Generate the histogram below of monthly passengers Additional requirements:
Generate two groups to compare. Group 1 should be the years 1949-1950. Group 2 should be the years 1959-60.
Binwidth of 50 from 100 to 700
yticks from 0 to 24, spaced by 2
Be sure to include a legend
temp1=passengers[ (passengers['Year' ]>=1949 ) & (passengers['Year' ]<=1950 )].groupby(['Month' ])['AirPassengers' ].sum ().reset_index() temp2=passengers[ (passengers['Year' ]>=1959 ) & (passengers['Year' ]<=1960 )].groupby(['Month' ])['AirPassengers' ].sum ().reset_index() plt.figure(figsize=(8 ,6 )) plt.hist(temp1['AirPassengers' ],bins=12 ,alpha=0.5 ,range =(100 ,700 ),label='1949-50' ) plt.hist(temp2['AirPassengers' ],bins=12 ,alpha=0.5 ,range =(100 ,700 ),label='1959-60' ) plt.xlabel("Month" , size=14 ) plt.ylabel("Hundreds of thousands" , size=14 ) plt.yticks(np.arange(0 , 24 , 2.0 )) plt.title("plot with Matplotlib" ) plt.legend(loc='upper right' )
<matplotlib.legend.Legend at 0x2d3705b9d90>