For some popular machine learning algorithms, how to set the hyper parameters could affect machine learning algorithm performance greatly.
One naive way is to loop though different combinations of the hyper parameter space and choose the best configuration. This is called grid search strategy. But this method could be very slow.
A better way is to use some kind of optimization method to optimize our optimization. Tools such as Optuna and Hyperopt play roles here.
In the following, we will use the Optuna as example, and apply it on a Random Forrest Classifier.
1. Import libraries and get the newsgroup data
import numpy as np
import os
from sklearn.datasets import fetch_20newsgroups
from sklearn.model_selection import cross_val_score
from sklearn.metrics import f1_score
from sklearn.feature_extraction.text import TfidfVectorizer
from sklearn.pipeline import Pipeline
import joblib
from lightgbm import LGBMClassifier
from sklearn.ensemble import RandomForestClassifier

import optuna

data = fetch_20newsgroups()

X = data['data'][:5000]
y = data['target'][:5000]
2. Define a machine leaning pipeline with TfidfVectorizer and RandomForestClassifie
model = Pipeline([
    ('tfidf', TfidfVectorizer(stop_words='english')),
    ('rf', RandomForestClassifier())
])
3. Define hyper parameter space and Optuna objective to optimize
return -np.mean(cross_val_score(model, X, y, cv=3, n_jobs=-1,scoring='neg_log_loss'))
Notice that, by default Optuna tries to minimize the objective function, since we use native log loss function to maximize the Random Forrest Classifier, we add another negative sign in in front of the cross-validation scores.
4. Run the Optuna trials to find the best hyper parameter configuration
# by default, the direction is to minimizae, but can set it to maximize too #study = optuna.create_study(direction='minimize') study = optuna.create_study()
# to record the value for the last time joblib.dump(study, 'study.pkl')
Notice that, we are saving the hyper parameter optimization process into a local pickle file, which means we can monitor the process in the middle or at the end by opening another notebook.
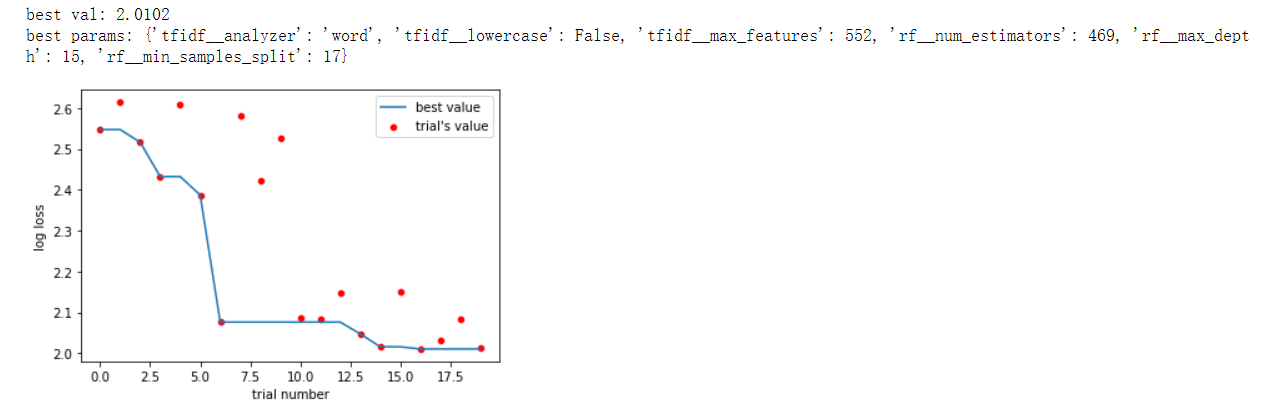
5. how to visualize the results
%matplotlib inline import joblib import pandas as pd import numpy as np import matplotlib.pyplot as plt import seaborn as sns import optuna
Reprint policy:
All articles in this blog are used except for special statements
CC BY 4.0
reprint policy. If reproduced, please indicate source
robot learner
!